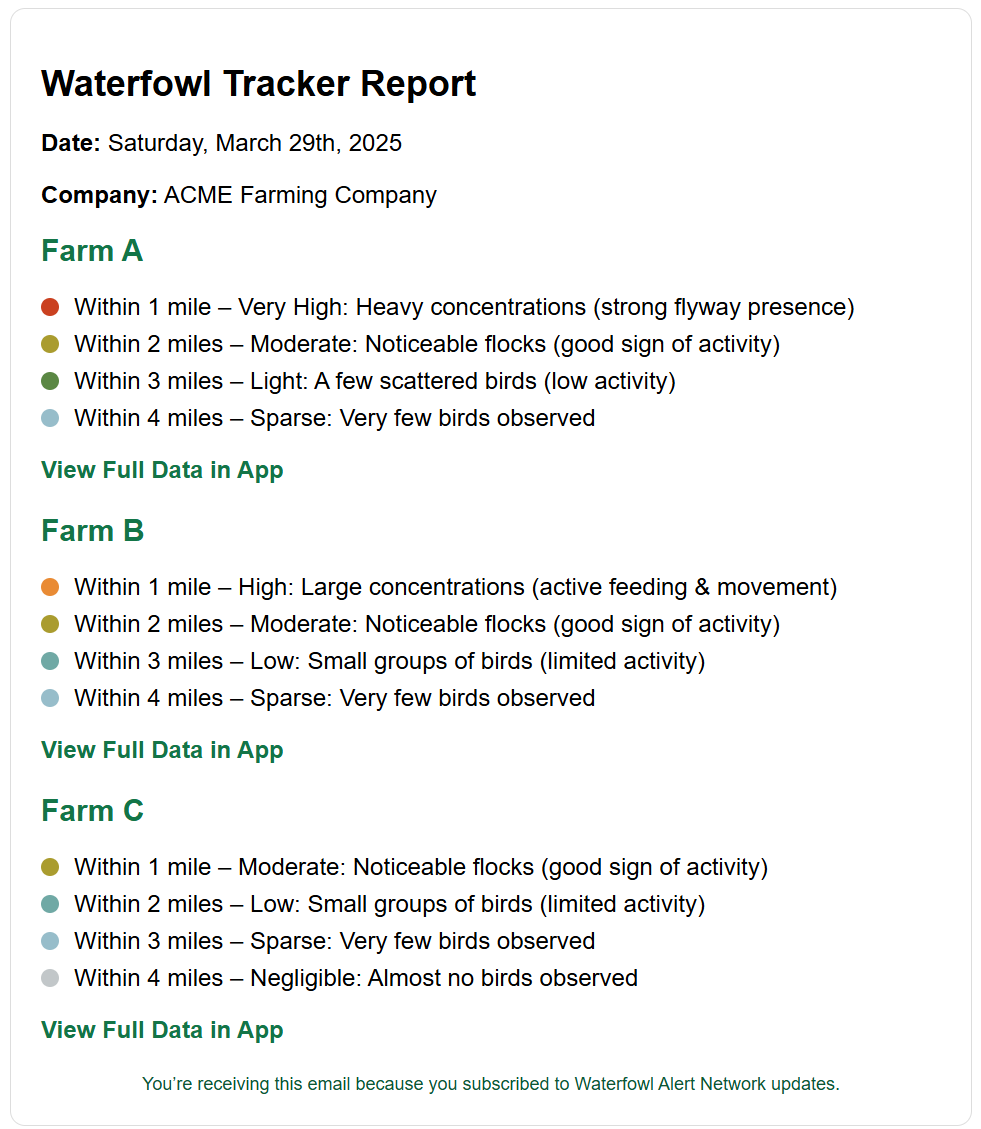
Each morning, you receive a risk report for every one of your farms. We break it down by 1, 2, 3, and 4-mile radiuses using a stoplight-style color system and plain-language risk descriptions.
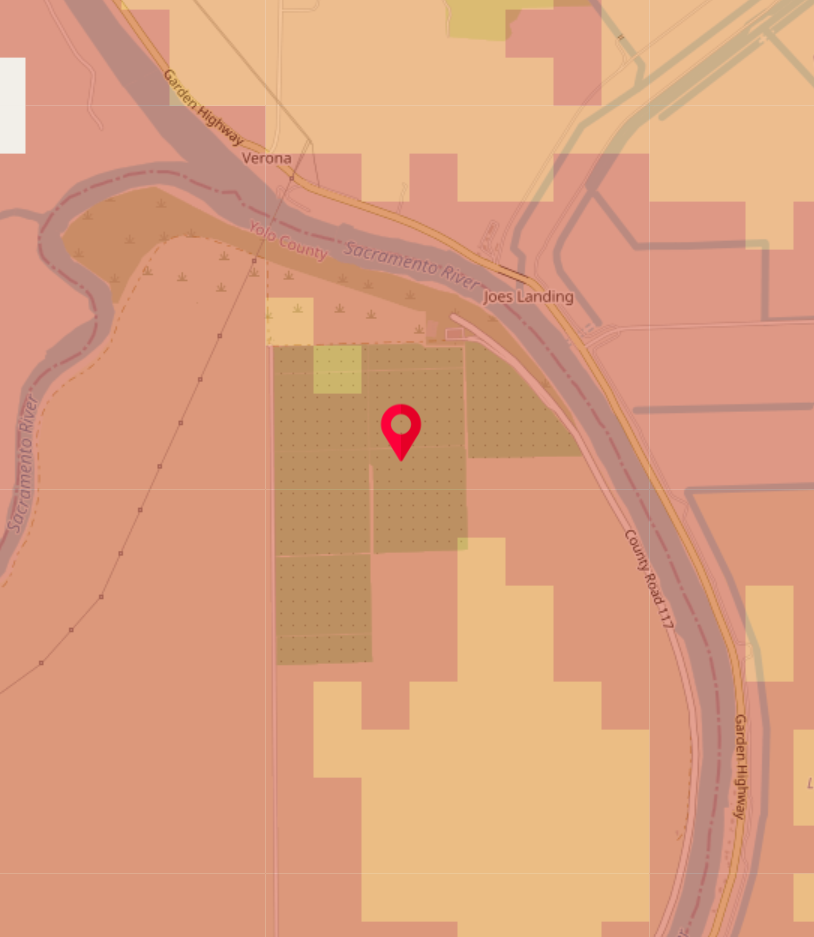
Zoomable Web Dashboard
Explore waterfowl migration data using an interactive map. Drill down to specific farms or zoom out to see national-scale bird migration patterns.
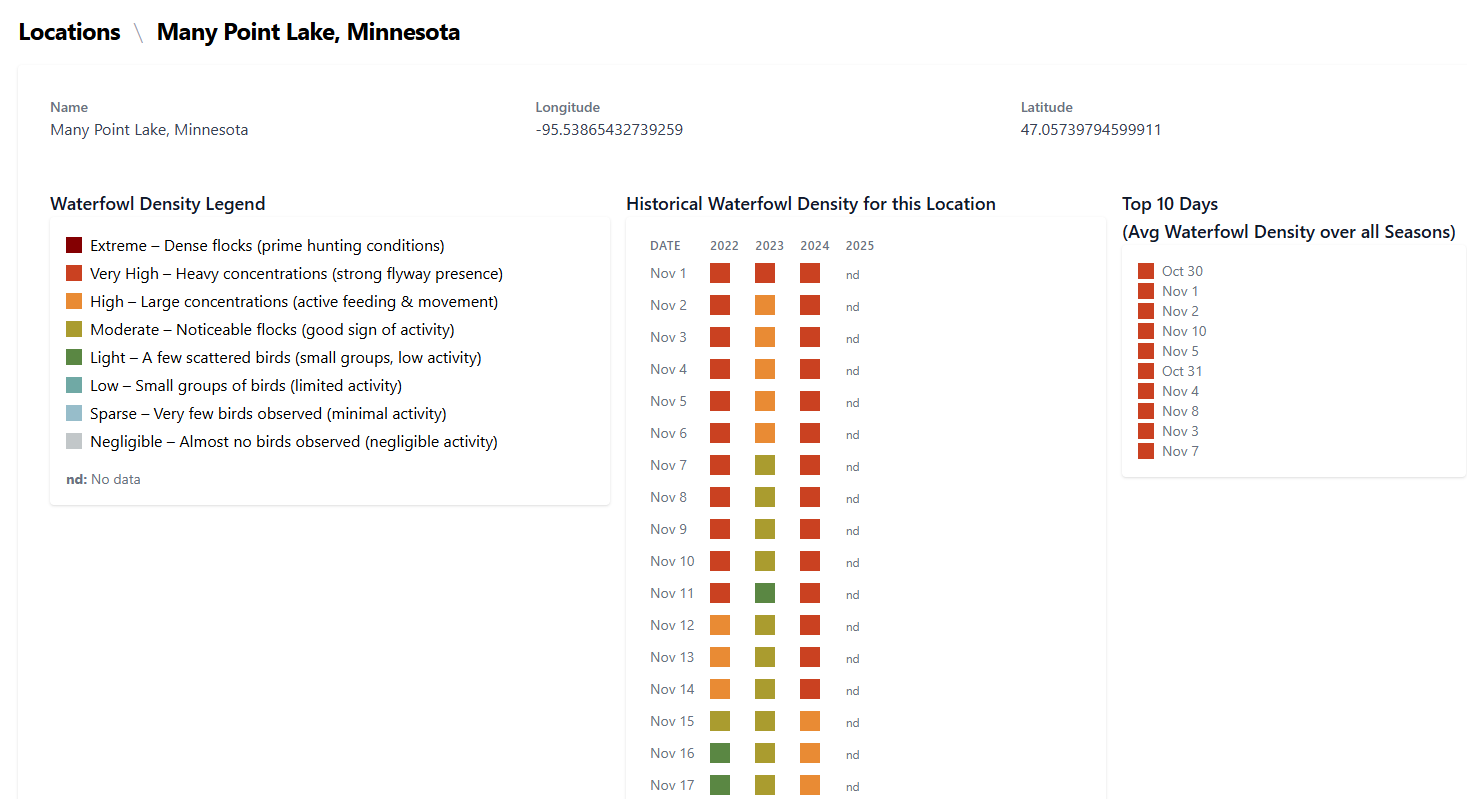
12 Years of Historical Data
Track long-term trends and understand seasonal migration patterns around your farms. Historical data informs strategic decisions like land acquisition and seasonal ramp-ups.
Monthly Expert Consulting
You get up to 5 hours/month of personalized support from our epidemiology and data science teams. Ask questions, review risk events, or fine-tune your use of the platform.
Personalized Onboarding
Each subscription includes a kickoff session with a WFAN expert. We’ll review your farm locations, walk through the tools, and offer early recommendations based on our data.
Get a Free Demo
Sign up for a free no-pressure call to see how we can help your operation